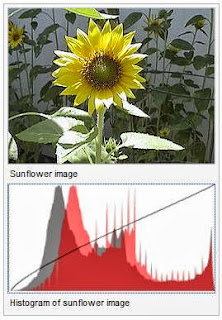
 An image histogram is a type of histogram that acts as a graphical representation of the tonal distribution in a digital image. It plots the number of pixels for each tonal value. By looking at the histogram for a specific image a viewer will be able to judge the entire tonal distribution at a glance.
Image histograms are present on many modern digital cameras. Photographers can use them as an aid to show the distribution of tones captured, and whether image detail has been lost to blown-out highlights or blacked-out shadows.
Using Matlab We Can get Histogram of any Image : hist()
Syntax :
- hist(data) example
- hist(data,nbins) example
- hist(data,xvalues) example
- hist(axes_handle,___) example
- nelements = hist(___)
- [nelements,centers] = hist(___) example
- hist(data) creates a histogram bar plot of data. Elements in data are sorted into 10 equally spaced bins along the x-axis between the minimum and maximum values of data. Bins are displayed as rectangles such that the height of each rectangle indicates the number of elements in the bin.
- hist(data,nbins) sorts data into the number of bins specified by nbins.
- hist(data,xvalues) uses the values in vector xvalues to determine the bin intervals and sorts data into the number of bins determined by length(xvalues). To specify the bin centers, set xvalues equal to a vector of evenly spaced values. The first and last bins extend to cover the minimum and maximum values in data.
- hist(axes_handle,___) plots into the axes specified by axes_handle instead of into the current axes (gca). The option axes_handle can precede any of the input argument combinations in the previous syntaxes.
- nelements = hist(___) returns a row vector, nelements, indicating the number of elements in each bin.
- [nelements,centers] = hist(___) returns an additional row vector, centers, indicating the location of each bin center on the x-axis. To plot the histogram, you can use bar(centers,nelements).
Simple Program Using Matlab to Compare 1 Image with other 4 Images :
% read two images
Image1 = imread('i1.jpg'); % Image 1
Image2 = imread('i2.jpg'); % Image 2
% convert images to type double (range from from 0 to 1 instead of from 0 to 255)
Imaged1 = im2double(Image1);
Imaged2 = im2double(Image2);
% reduce three channel [ RGB ] to one channel [ grayscale ]
Imageg1 = rgb2gray(Imaged1);
Imageg2 = rgb2gray(Imaged2);
% Calculate the Normalized Histogram of Image 1 and Image 2
hn1 = imhist(Imageg1)./numel(Imageg1);
hn2 = imhist(Imageg2)./numel(Imageg2);
subplot(2,2,1);subimage(Image1)
subplot(2,2,2);subimage(Image2)
subplot(2,2,3);plot(hn1)
subplot(2,2,4);plot(hn2)
% Calculate the histogram error
f = sum((hn1 - hn2).^2);
disp(f) %display the result to console
Using GUI:
Type Guide in Command Window
Browse and Select File Downloaded from below
You Will get like this
Press Run Button
Output Will be...
Load Image By Right Clicking each corresponding button for each Image.
And Click Compare button, Which Compares Image 1 with all other images [ 2,3,4,5 ].
And You will get Results under the Images.
Higher Value = More Difference
Lesser Value = Lesser Difference
0 = No Difference
Download Links :
- compare.m : Click Here to Download
- compare.fig : Click Here to Download


